This work is licensed under a Creative Commons Attribution-ShareAlike 3.0 Unported License. This means that you are able to copy, share and modify the work, as long as the result is distributed under the same license.
Integrated assignment: g:Profiler/EnrichmentMap
By Veronique Voisin
Integrated Assignment Day 2
Background:
Stomach cancer or gastric cancer is cancer developing from the lining of the stomach. The most common cause is infection by the bacteria Helicobacter pylori, which accounts for more than 60% of cases. Certain types of H. pylori have greater risks than others. Other common causes include eating pickled vegetables and smoking.
The integrated assignment day 1 showed how transcriptomics and pathway analysis is used for trying to understand how a cancerous tissue has evolved from normal tissue. Another common strategy it to sequence the DNA of cancerous tissue to find out the mutations. MutSig is a mutation signal processing tool created by Broad Institute. It estimates the significance of the gene mutation rate based on abundances of the mutations, clustering of the mutations in hotspots and conservation of the mutated positions.
The gene list for this assignment is the output from MutSig run based on Stomach Adenocarcinoma somatic mutations found in ~300 samples. It is publicly available through TCGA portal.
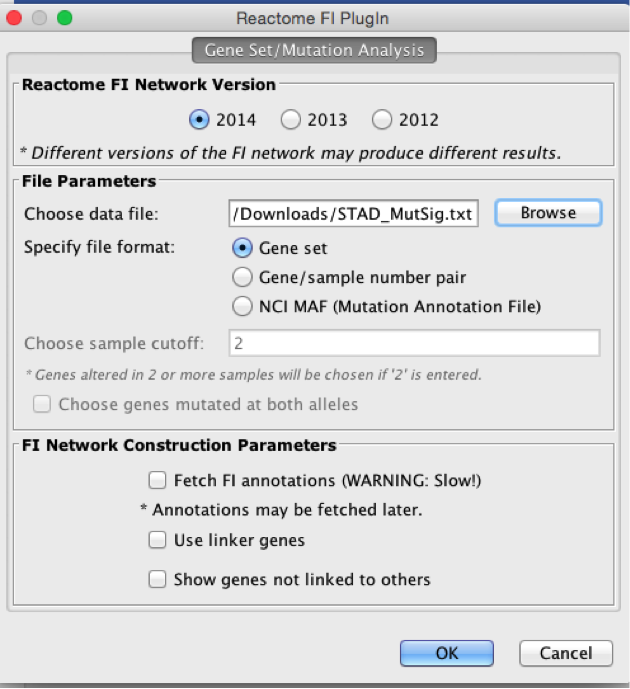
File provided: STAD_MutSig.txt
Goal
Familiarize yourself with ReactomeFI, learn how to do a pathway and network-based analysis.
-
Open Cytoscape
-
Choose Apps > ReactomeFI -> Gene set/ mutation analysis
-
Upload STAD_MutSig.txt and build a network without linkers
-
How many genes (nodes) and interactions (edges) are in the network (Hint: check control panel)?
-
Try different layouts (for example: Layout -> yFilesLayout -> Circular). Which do you like the most?
-
Run Pathway annotation (Hint: right click on the network panel and follow the path showed below)
-
What is the most significant pathway? How many genes from our set belong to this pathway?
-
Run enrichment analysis for GO:Molecular Function annotations. What is the most significant molecular function for this set?
-
In Table Panel, select the “Pathways in Network” tab. Click on “ErbB signaling” pathway line in the table. Genes in the network that belong to this pathway will be colored yellow. By what knowledgebase this pathway was curated? How many genes does this pathway contain?
-
Hide all genes that DO NOT belong to “ErbB signaling” (Hint: Select ->Node -> Invert node selection, Select -> Node -> Hide selected nodes) . Deselect these selected nodes to create an ErbB-specific subnetwork. Have a close look at the genes.
-
What types of interaction are between CTNNB1 and CDH1 (Hint: highlight the queried interaction, go to Table Panel and open Edge Table tab. Find FI annotation).
-
HIghlight “ErbB signaling” in the Table Panel, right click and choose “Show diagram pathway”. A new browser page with the KEGG diagram will appear. Genes of interest will be highlighted with red.
-
How many interactive partners does CDH1 have in gastric cancer-related network? How many in the whole FI network? (Hint: right click on the node, select Reactome FI > fetch FIs).
-
Start a new network. Go to Apps > Reactome FIs > GeneSet/ Mutation Analysis and upload the STAD_MutSig.txt file (as in step1, do not save session). Run network clustering (Hint: Right click on the network panel, choose Apps -> reactome FI -> Cluster FI Network). Nodes colored with the same color belong to the same module. Modules are mutually exclusive meaning that a gene can belong only to one module.
How many modules does this network have?
Do all modules have similar size?
How many nodes does the biggest module have?
-
The most interesting aspect of the network analysis is a module enrichment test (Hint: Right click on the network panel, choose Reactome FI → Analyze Module Functions -> Pathway enrichment). Enrichment analysis will be done for each module separately (or you can determine a module size cutoff before analysis starts - usually it is a good practice to ignore very small modules). Don’t forget to adjust FDR (on Table Panel) to something more significant like 0.05.
-
Switch to tab “Pathways in Network” in the Table Panel (or run the network pathway enrichment analysis: right click on a blank tab > Reactome FI > Analyze network functions > Pathway enrichment) . Highlight “ErbB signaling pathway”. Are the genes from this pathway belonging to one or several modules?
-
Re-build your subnetwork using linkers (you can save or destroy your previous work)
What does “linker” mean?
How many nodes and edges are in the network?
-
Run (1) pathway enrichment analysis (adjust FDR to 0.01); (2) clustering and (3) module based pathway enrichment analysis (adjust FDR to 0.01).
-
OPTIONAL: Find a quick way to calculate how many linkers are in the network.
-
OPTIONAL: Are there any modules that are not enriched in any pathways? Save genes from one of these modules in.txt file. We will use in GeneMANIA.
-
OPTIONAL: Using search box (right upper corner of the Cytoscape) find gene EP300. What module does it belong to?
-
OPTIONAL: Save your network as .jpeg or .pdf. Choose resolution 300 dpi and zoom in 300%. Open your saved image. Zoom in. Does the quality of the image suit your needs (poster, publication, .ppt presentation)?
GeneMANIA
The major function of the GeneMANIA is a gene function prediction based on association data like protein and genetic interactions, pathways, co-expression, co-localization and protein domain similarity.
Goal
Get familiar with GeneMANIA Cytoscape app. (alternatively, if you have not installed the GeneMANIA data, you can use the website version to this exercise).
Task
Functional Interaction Network (FIN, the Reactome FI database) contains ~50% of all human genes. So, a good portion of the genes of interest might be excluded from the network-based analysis just because these genes have not been curated so far. MutSig predicted 162 genes to be significant in gastric cancer. Of those 132 are in FIN. Let investigate 30 excluded from FIN genes using GeneMANIA.
-
Open Cytoscape
-
Go App -> GeneMANIA -> Search…
-
Copy top 30 genes from the STAD_MutSig.txt file (until ODZ1) and paste them into “Genes of interest” window. In Advanced options, set number of related genes (analog to linkers) to 20. Click on the “START” button.
-
What kind of conclusions can you make about functional relationships between presented genes based on the network?
-
Go back to GeneMANIA input panel (App > GeneMANIA > Search…) and add an attribute: Transcriptional-Factor-Targets-2013. Re–built a network. Go to Results Panel and find which transcription factor (TF) has the highest score. How many genes from our initial gene list this TF is regulating?
-
OPTIONAL Play with other attributes. Check how these attributes are refining your knowledge about unknown set of genes.
-
OPTIONAL: Upload to GeneMANIA a saved gene list from your previous FI network-based analysis (FBXW7,KCND3,KCNIP3,LRP2,PSEN1,RYR3). Use different GeneMANIA options to discover their functions and relationships (build a network without and with top related genes, add attributes(s), find a TF that regulate some gene s of interest. Save your final network as .jpeg.
HOPE WHAT YOU HAVE LEARNED TODAY WILL BE USED FOR YOUR RESEARCH.